Faces
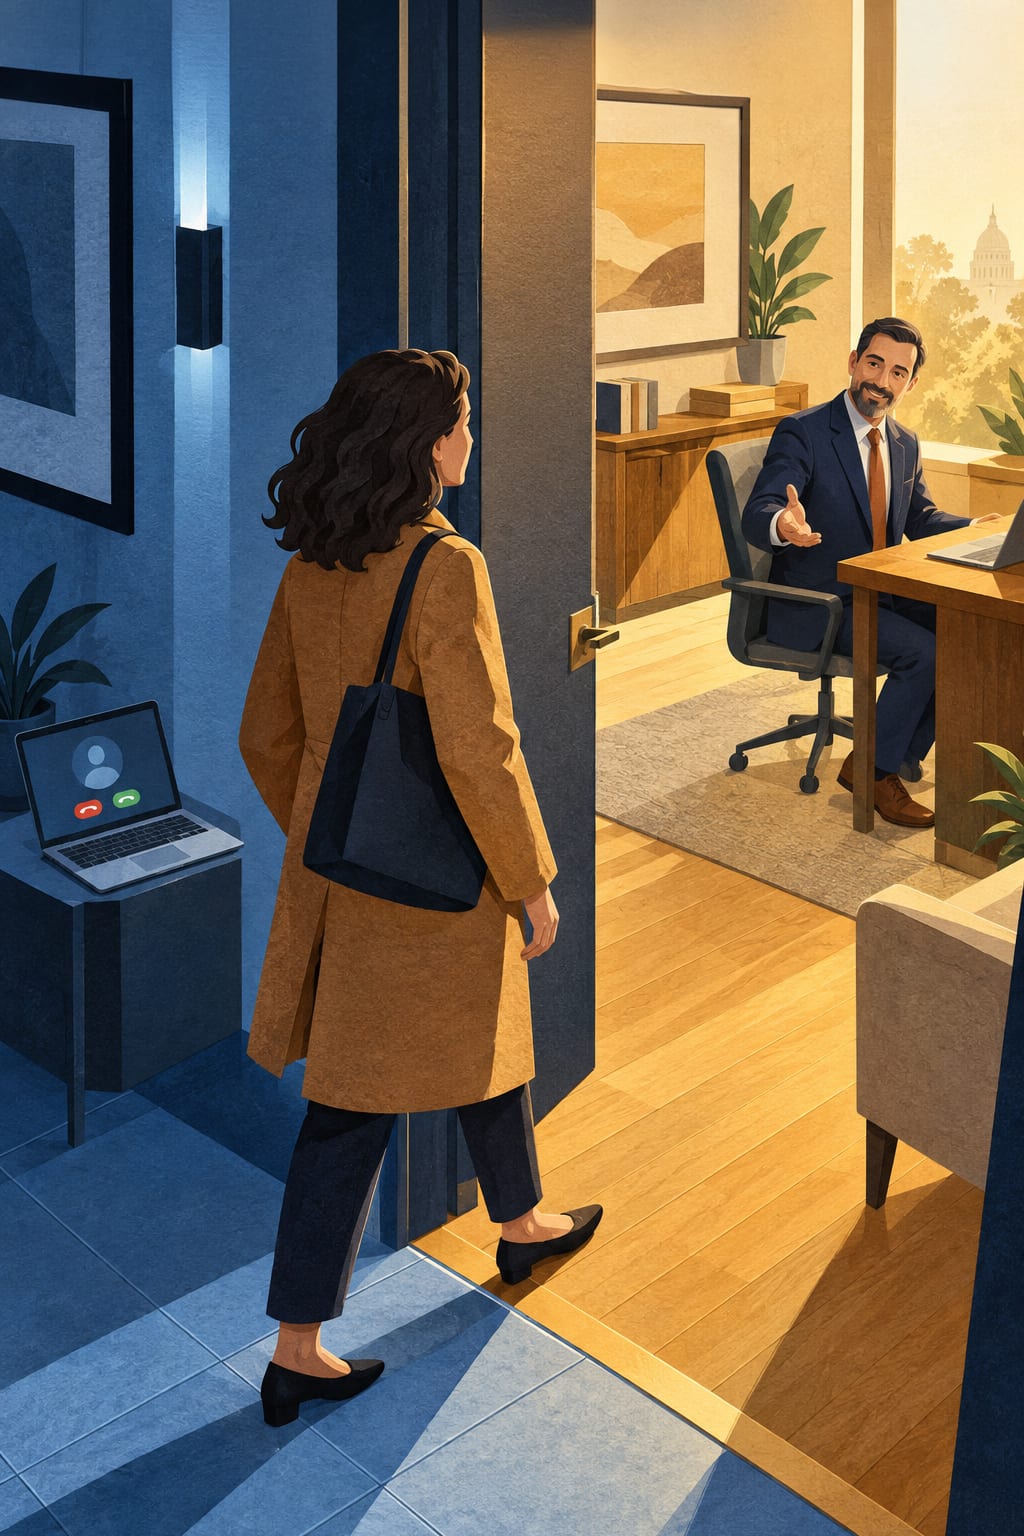
Welcome to The Trust Times, our magazine about the science of building trust. What’s the role of a human face in building trust these days? It depends, and that’s the topic we explore in this issue.
The first study we’ve highlighted is from the Journal of General Internal Medicine. Swedish patients who had seen a doctor in person, by video or by chat said whether they trusted the person they met. The format mattered, a lot.
The second, from Frontiers in Psychology, pools experiments in which people rated computer-drawn faces built to look fully human, roughly human, or cartoonish. The most lifelike faces were rated the most trustworthy. The faces in the middle, almost human and slightly off, ranked as the eeriest of the three, below even the cartoons.
The third, from Social Cognitive and Affective Neuroscience. Adults in their twenties and seventies were told how much each person in a set of strangers had shared with them, then chose which strangers to deal with again. The younger group went back to the ones who had shared the most. The older group could not reliably recall who had. They remembered the stingy ones as kinder than they were, and chose by how generous a face looked.
I chose these three because more of your client contact runs through a screen every year, and each study finds that what a client sees of you moves their trust on its own, apart from anything you have done for them.
Three more great studies on trust next week.

Sources · Issue No. 10
About This Issue
Three peer-reviewed studies on how trust is built, retold in plain language. The “at your desk” sections are our editorial application, not claims made by the researchers.
How much of a client’s trust rides on what they see of you: the room you meet in, how much of a real face reaches them through a screen, and, for older clients, how you look to them rather than what you have done for them.
In our previous issue we covered three studies on what decides how much a mistake costs you with a client. Read the previous issue.
Patients Who Met a Doctor in Person Trusted Them Most, and Video Came Last
A survey of 3,315 Swedish primary-care patients compared in-person visits, video calls and text chat. Of the in-person patients, 76 percent said they trusted the doctor completely. Video patients were the least likely to say so, and the most likely to say they felt no trust at all. Chat landed close to face to face in person.
Söderberg, D., Bonn, S. E., Sjöblom, L., Dahlgren, A., Muli, I., Amer-Wåhlin, I., Bertilson, B. C., Farrokhnia, N., Hvitfeldt, H., Taloyan, M., Hägglund, M., & Trolle Lagerros, Y. (2024). Visit experience and fulfillment of care needs in primary care differs for video visits compared to in-person and chat visits. Journal of General Internal Medicine, 39(15), 2881-2887. Open access: doi:10.1007/s11606-024-08781-z
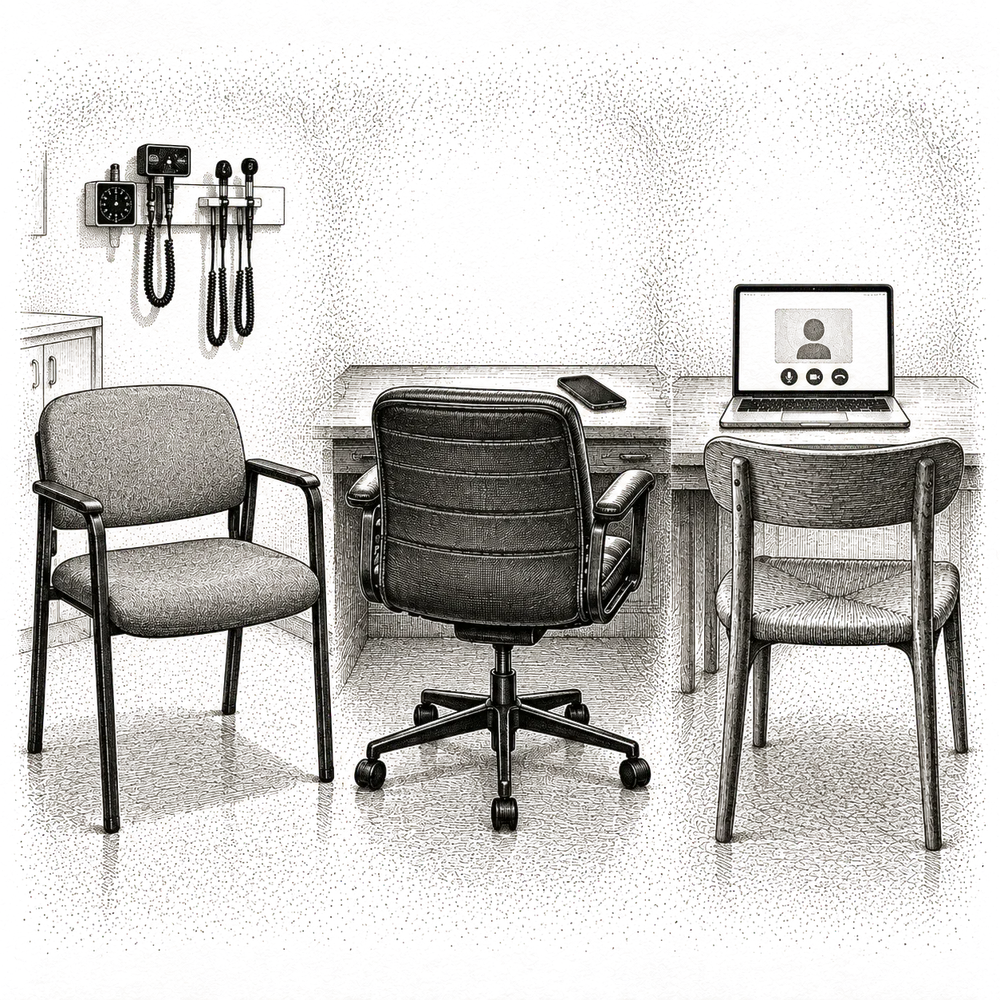
A woman in Stockholm has had a cough for two weeks. She can book a visit at her health centre and sit in the waiting room, open an app and see a doctor by video, or type her symptoms into a chat window and get a doctor’s answer in writing. During the pandemic Swedish primary care offered all three, and patients picked whichever they wanted.
Daniel Söderberg and eleven colleagues in Sweden asked 3,315 of those patients the same question after their visit: did you feel trust and confidence in the person you met?
The study

The researchers surveyed patients at primary health care centres and at three of Sweden’s four largest private telemedicine providers, which together served about two thirds of that market in 2020, plus the one public telemedicine provider in the Stockholm region. Of the 3,315 who answered, 1,950 had seen a physician in person, 844 by video, and 521 by chat.
Everyone answered the same questions, taken from a survey the UK uses to evaluate its own primary care. During the visit, were you listened to? Treated with care? Given enough time? Did you feel trust and confidence in the person you met? Were your care needs fulfilled? The trust question had four answers: yes completely, yes to some extent, neither yes nor no, and not at all.

What they found
Of the in-person patients, 76.4 percent said yes, they trusted completely. Of the chat patients, 71.8 percent did. Of the video patients, 62.5 percent did. At the other end of the scale, 2.4 percent of in-person patients said they felt no trust at all, against 3.0 percent of chat patients and 7.8 percent of video patients. A video patient was more than three times as likely as an in-person patient to come away with no trust in the doctor.
Other questions were similar, too. Video patients were the least likely to say they had been listened to, treated with care or given enough time, and the least likely to say their needs had been met. Chat patients were the most likely to say they had been given enough time, and the most likely to say their needs had been met, ahead of the patients who had been in the room.
Why video came last
Patients chose their own visit, and the three groups were different people. Video and chat patients were younger, healthier and more often working. Over a third of in-person patients were 64 or older; under a tenth of video patients were. A third of in-person patients were retired; among video patients it was fewer than one in twelve. And the visits ran differently: 87 percent of in-person visits lasted ten minutes or more, against 32 percent of video visits.
The authors give two reasons the camera may have done worst. A video patient in this study had chosen video for whatever was wrong that day, and some of them may have needed an examination a camera cannot provide. And the doctor on the screen was usually a stranger. A patient’s regular provider could well have given a better video experience than a provider the patient had never met.

Chat is the surprise. No face, no voice, and patients came out nearly as trusting as the ones in the room, and more satisfied that their needs had been met. The chat patients were also the least worried when they booked: 55 percent said they were not worried at all, against 28 percent of in-person patients. The authors read the three formats as suited to different patients and different problems rather than as better and worse versions of the same visit.
What This Could Mean at Your Desk
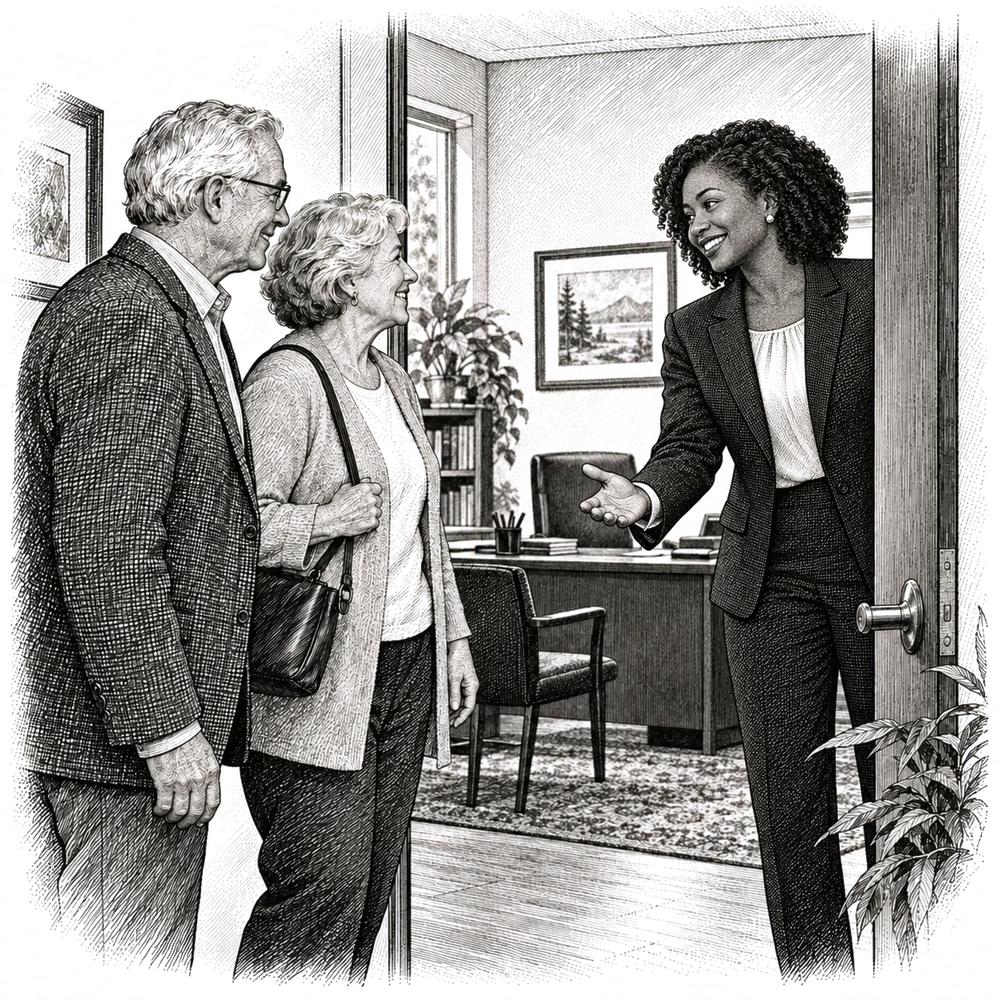
Meet a new client in the room. The patients who trusted least were, for the most part, meeting a doctor for the first time, by video, for a short visit. That describes most first meetings with a prospect. If the prospect can reach your office, or you can reach theirs, hold the first meeting in person and keep video for the people who already know you.
Book a video call for the length of an office visit. Nearly two thirds of the video visits in this study were over in under ten minutes. Patients rated being given enough time the same way they rated trust, with video last. When a review has to happen on a screen, give it the hour you would give it in the office, and say so at the start.
A written answer holds up. Chat patients came out close to in-person patients on trust and ahead of them on needs met. A clear written reply to a client’s question, from you and signed by you, is not a downgrade from a call. It may be the format the client wanted.
Check who you have moved to video. In this study the oldest patients and the retired chose the room. If your older clients are the ones you have shifted to video calls for convenience, ask whose convenience that served, and offer them the room back.
The bottom line
Patients who saw a doctor in person trusted them most, patients who typed to one came close, and patients who saw one on a screen trusted least and were the most likely to report no trust at all. Patients picked their own format, so the screen alone cannot be blamed for the gap. But a short video call with a stranger was the visit Swedish patients trusted least. Check whether it is the version your own first meetings on a screen turn into.
Lifelike Digital Faces Earned the Most Trust, and Almost-Human Ones Ranked Eeriest
Researchers pooled 13 experiments, 2,343 people in all, that showed people computer-drawn faces built to look fully human, roughly human or cartoonish. The most lifelike faces were rated the most trustworthy. The faces in the middle ranked as the eeriest of the three.
Tao, Z., Liu, Y., Qiu, J., & Li, S. (2025). Impact of virtual avatar appearance realism on perceptual interaction experience: A network meta-analysis. Frontiers in Psychology, 16, Article 1624975. Open access: doi:10.3389/fpsyg.2025.1624975

The face on the other side of the screen is not always a person any more. Firms put drawn faces in front of customers as animated stand-ins on video calls, rendered assistants on help pages, and digital presenters in explainer videos. Anyone who does that has to decide how real the face should look.
Zhiyu Tao and three colleagues gathered every experiment from the past decade that had shown people such faces at different levels of realism and asked how they felt about them, then combined the results.
The studies

They searched four research databases for work published between April 2015 and April 2025 and kept 13 studies that had compared at least two levels of realism and measured at least one of three reactions: how attractive people found the face, how trustworthy, and how eerie. The 13 studies covered 2,343 participants in China, the Netherlands, Australia, France, Ireland, Germany and the United States. Most participants were men, and two of the studies included only men.
Each face was sorted into one of three levels. High realism meant detailed skin, human proportions and human anatomy. Medium realism meant basic human proportions with stylised or blurred features. Low realism meant exaggerated features and simplified, cartoon-like forms.
No single experiment had tested all three levels against each other, so the researchers combined them in a way that let every level be ranked against every other. They report each level’s standing as the probability that it would come out on top.
What they found
Eight of the 13 studies had measured trustworthiness. High-realism faces were rated more trustworthy than low-realism faces, and in the ranking they had a 96.2 percent chance of being the most trusted level, against 29.9 percent for medium and 23.9 percent for low. The gap between the middle level and either end was too small to call.
Five studies had measured eeriness, and there the order broke. The medium level had a 74.5 percent chance of ranking as the eeriest of the three, against 44.7 percent for high realism and 30.9 percent for low. No single gap between two levels was large enough to call on its own; the ranking is the finding. A face that was almost human, and a bit wrong, came out ahead of both a fully drawn human and a plain cartoon. The authors put this down to the uncanny valley, a term from robotics for the drop in comfort that occurs as a figure gets close to human without arriving.
Attractiveness ran with trust. High-realism faces had a 99.5 percent chance of ranking most attractive.
Headset or flat screen
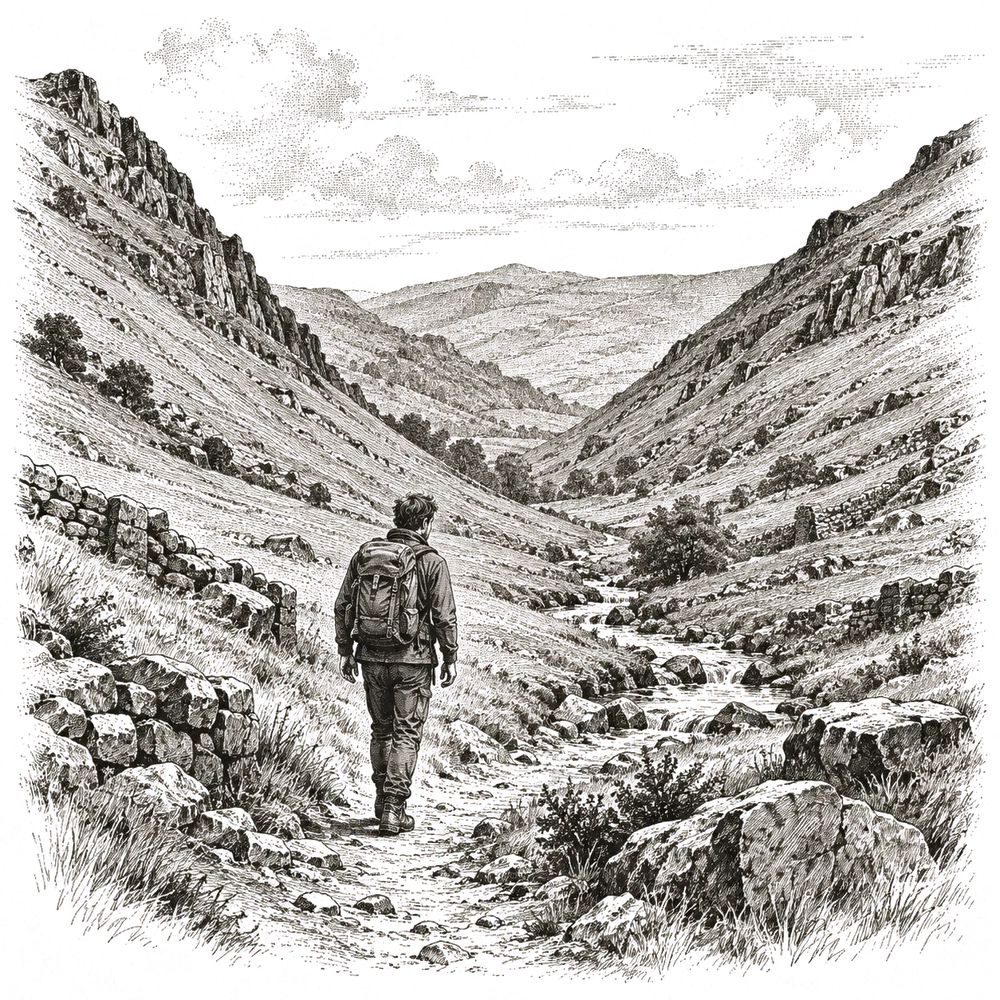
The researchers then split the studies by how people had viewed the faces: inside a virtual-reality headset, or on an ordinary screen. In the headset the order for trust held, high above medium above low. On a flat screen the cartoons moved up. The authors think habit may explain it: people have spent years watching cartoon characters on phones and televisions, so a stylised face reads as familiar there, but an almost-human one stands out as off.
What This Could Mean at Your Desk
Camera on, and a real camera. The faces people trusted most were the ones closest to a real human face, and no drawn face in these studies could be more realistic than your own. Your face, on a decent camera in decent light, is the most lifelike face a client can get through a screen. A stylised avatar or a beautifying filter moves you down the scale.

Do not put an almost-human face in front of clients. If your firm is weighing a rendered assistant for the website or a digital presenter for explainer videos, the level to avoid is the middle one: human proportions, waxy skin, a stiff mouth. In these experiments that face ranked eeriest, above the plain cartoon. Use a real person, or a face that is clearly drawn.
On a flat screen, a simple drawing beat a half-finished human. When people viewed faces on ordinary screens, the plainly drawn ones outranked the almost-human middle on trust. A clearly illustrated portrait on a bio page, or an obviously drawn character in a client video, sits on the safe side of that line. A rendering that is trying to pass for a photograph, and not quite managing, sits on the wrong side.
The bottom line
Across 13 experiments, the most lifelike drawn faces were rated the most trustworthy, and the faces that were almost human ranked as the eeriest of the three, below even the cartoons. The safest face to put in front of a client is your own, and the second safest is one that is plainly a drawing.
Older Adults Chose Partners by How Generous They Looked, Not by What They Had Done
In a study of 86 adults with average ages of 27 and 73, people learned how much each of 32 strangers had shared with them from a ten-dollar pot, then chose which strangers to deal with again. The younger adults went back to the generous ones. The older adults could not reliably recall who had been generous, and chose by the face instead.
van Geen, C., Cohen, M. S., Lempert, K. M., MacNear, K. A., Reckers, F. M., Zaneski, L., Wolk, D. A., & Kable, J. W. (2025). Age-related differences in trust decisions: When memory fails and appearances prevail. Social Cognitive and Affective Neuroscience, 20(1), nsaf032. Open access: doi:10.1093/scan/nsaf032
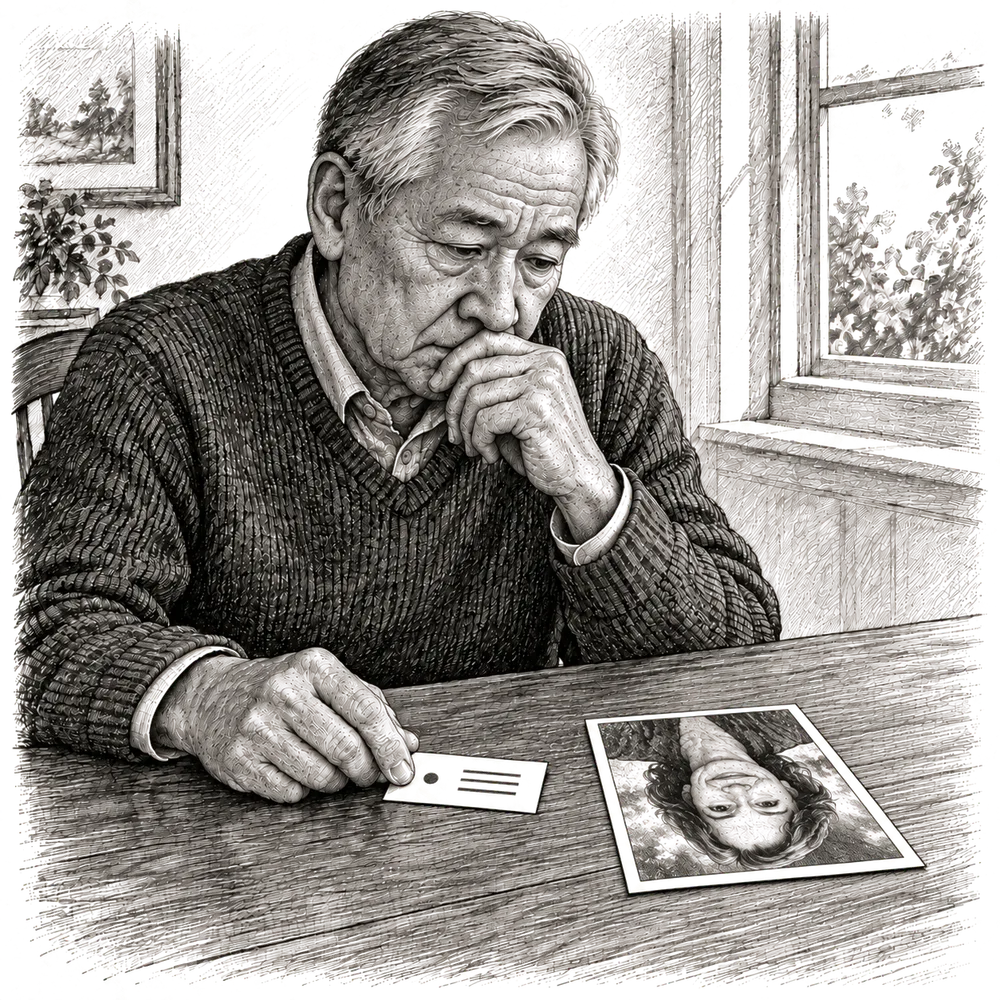
A man of 74 is deciding whether to take a second meeting with someone who wants to manage part of his money. They met once, three weeks ago. His memory of that meeting is thinner than he would like. What he has in front of him is a face that looks kind.
Camilla van Geen and seven colleagues at the University of Pennsylvania wanted to know what happens in that moment, and why it goes differently at 74 than at 27. They open with a figure from the FBI: in 2020, people over 65 accounted for 28 percent of the $4.1 billion lost to reported scams.
The experiment
The researchers recruited 86 adults: 41 older, aged 61 to 86 with an average age of 72.7, and 45 younger, aged 21 to 37 with an average of 26.5. Every older participant had been assessed as cognitively normal through the university’s Alzheimer’s research centre. Each person did the task inside a brain scanner.
First came learning. Thirty-two faces appeared one at a time, each a real person who had earlier decided how much of a ten-dollar pot to share with a stranger. Sixteen had shared five dollars. Sixteen had shared nothing. Each face appeared with what that person had chosen to share with you.
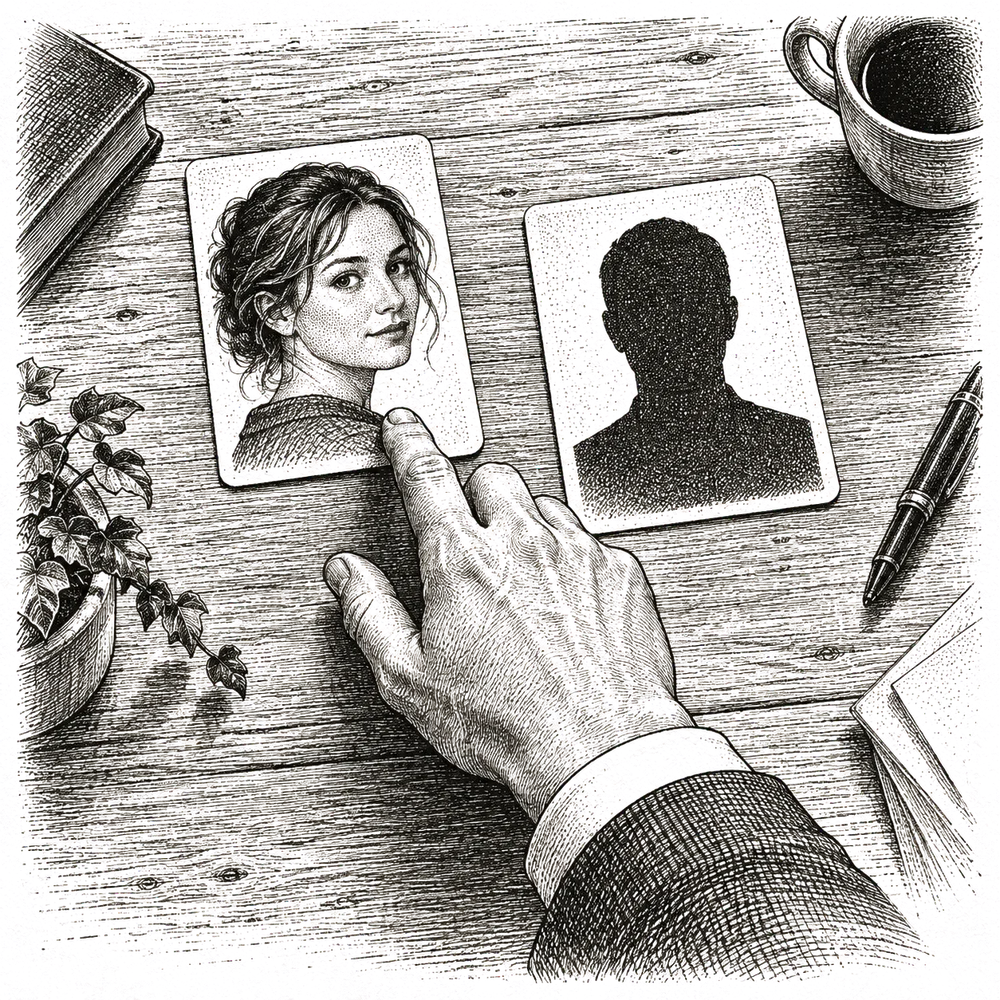
Then came choosing. On each of 48 trials, the participant picked between playing another round with a particular face and playing with someone drawn at random from the database, who had even odds of sharing five dollars or nothing. Thirty-two of the faces were from the learning task and 16 were new. The good choice was plain: take the face if it had shared five dollars, take the random stranger if it had shared nothing.
Separately, 20 raters who had not taken part scored every face on how much they thought that person would share. The researchers call that score perceived generosity. It is what a face looks like, with no knowledge of what the person did.
What they found
Younger adults made the good choice more often than chance. Older adults, taken as a group, chose no better than a coin flip. Whether a face had shared five dollars or nothing predicted the younger group’s choices and had no reliable effect on the older group’s.
Memory explained part of that. Both groups could tell which faces they had seen before. But when asked whether a face had shared five dollars or nothing, older adults could not answer better than chance, and when they were wrong they leaned one way: they were more likely to remember a stingy face as generous than a generous face as stingy. Younger adults recalled the amounts reliably and showed no such tilt.
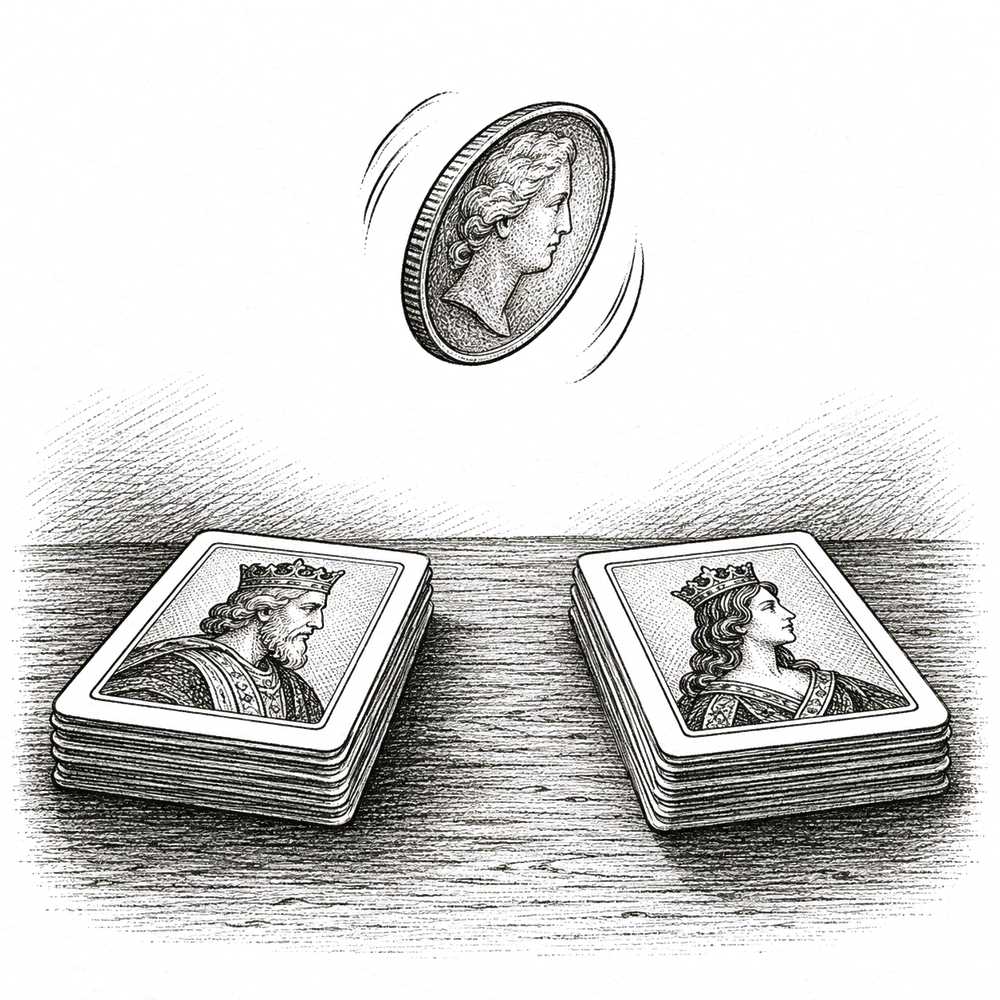
Looks explained the rest. Everyone favoured faces: across all trials, participants chose the face over the random stranger 62 percent of the time. Everyone was also swayed by perceived generosity. Faces the raters had judged generous were chosen more often, by both age groups, to the same degree.
The two groups came apart on the hard trials, where a generous-looking face had shared nothing. Younger adults could set the look aside and avoid the face. Older adults were more likely to pick it. Even on trials where an older adult had correctly remembered what a face had shared, their choice leaned less on that memory than a younger adult’s did.
The scans matched the behaviour. While people were learning what each face had shared, the hippocampus and the amygdala, two regions that store what happened and how it felt, were more active in younger adults, and activity there predicted better choices later at every age. On the hard trials, a region at the front of the brain that helps people ignore irrelevant information was more active in younger adults than in older ones.
Two things going at once
The authors describe two separate changes with age. Older adults took in less of what each person had done. And when what they did remember conflicted with how a person looked, they were less able to set the look aside. Either change alone would tilt a decision toward the face. Together they made the face nearly the whole decision.
What This Could Mean at Your Desk
Your track record may not be in the room. A client in their seventies may not carry a reliable memory of what you recommended last year, or what came of it. Bring the record with you: one page, at every review, listing what you advised, when, and what happened. You are supplying the part of the decision that this study found fades first.
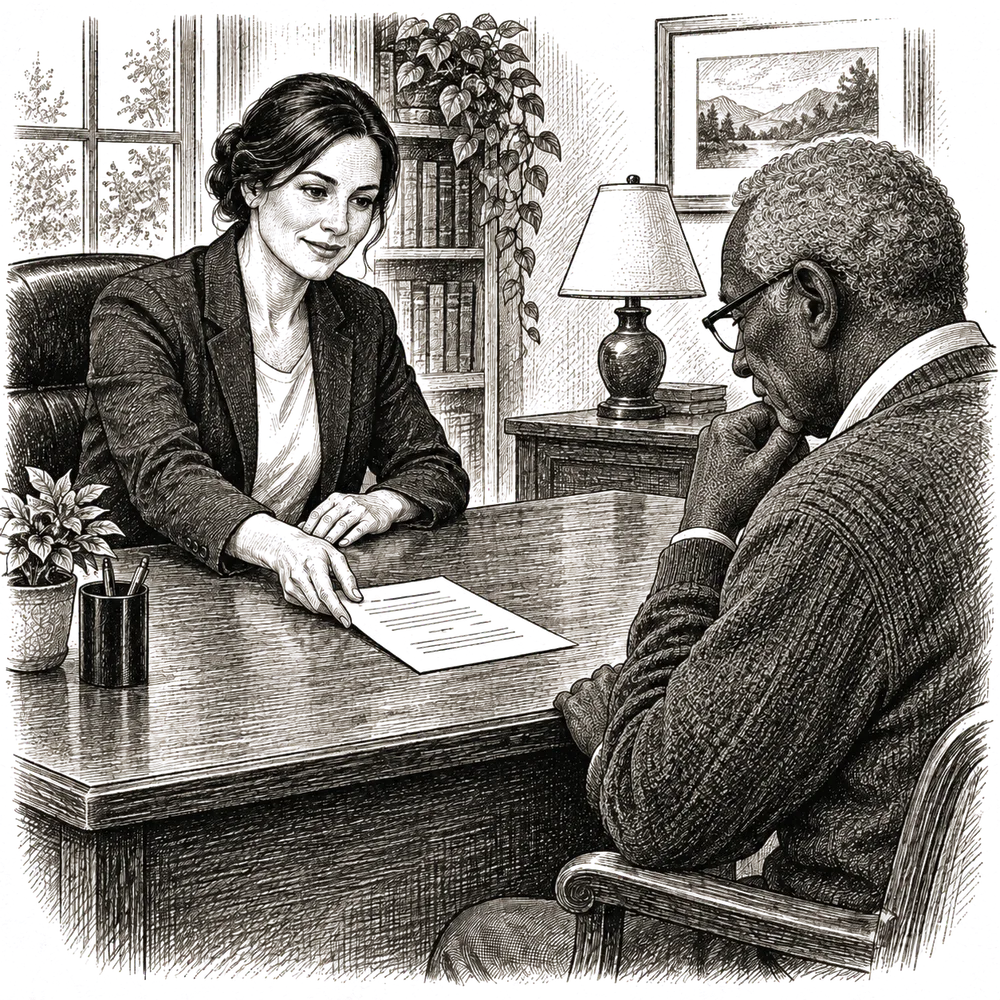
The tilt toward kindness cuts both ways. Older adults here remembered stingy partners as generous more often than the reverse. A mistake of yours may be forgiven faster than you fear. But the stranger who cost a client money last time may be remembered warmly too, and the authors open their paper with that worry: a memory slip of this kind is one reason older adults may be targeted by scams more often. Ask older clients to run any new pitch past you before they act on it, and tell them why: you are holding the record for them.
Show the same face, every time. How generous a face looked moved everyone’s choices, and for older clients it won out where it conflicted with the record. Be in the room or on camera, in person rather than through an assistant, with the same face and manner each time. In this study the face was the input older adults still had when memory had gone.
Write it down for them. When an older client is weighing a new person, a new manager or a new offer, send a short written summary of what was said and what was promised, and suggest they reread it before deciding. A page they can read replaces the memory this study found missing.
The bottom line
Younger adults went back to the strangers who had shared with them and avoided the ones who had not. Older adults could not reliably remember which was which, remembered the stingy ones as kinder than they had been, and chose by how generous a face looked. The record of what someone did is the part of a trust decision that fades first, so put it back in front of the client yourself.
The Trust Times is a running collection of independent, peer-reviewed research on how trust is built. Each issue distills a handful of studies into plain language, with a practical note on what it means in practice.